Searching MutEX is quite straightforward therefore users with no bioinformatics skills can also perform accurate searches across the database.
In all Functions pages, there are 33 cancer types arranged in alphapetical order. One or more cancer types can be selected to perform analysis.
Mutation Impact
Function I aims to identify differentially expressed genes between opposite mutation status (mutant vs. wild-type) for a specified set of genes.
Default Analysis
In addition to cancer type(s) selected in STEP 1, user can type, paste, select from folder or choose from pathway-genelists mutated gene(s) in
STEP 2.
When there is more than one gene specified, the results generated will be concatenated. In STEP 3, the FDR and/or Absolute Fold Change threshold to highlight
significant differential genes can be set by dragging the range slider or entering values between 0 and 0.05 and between 1 and 10 respectively.
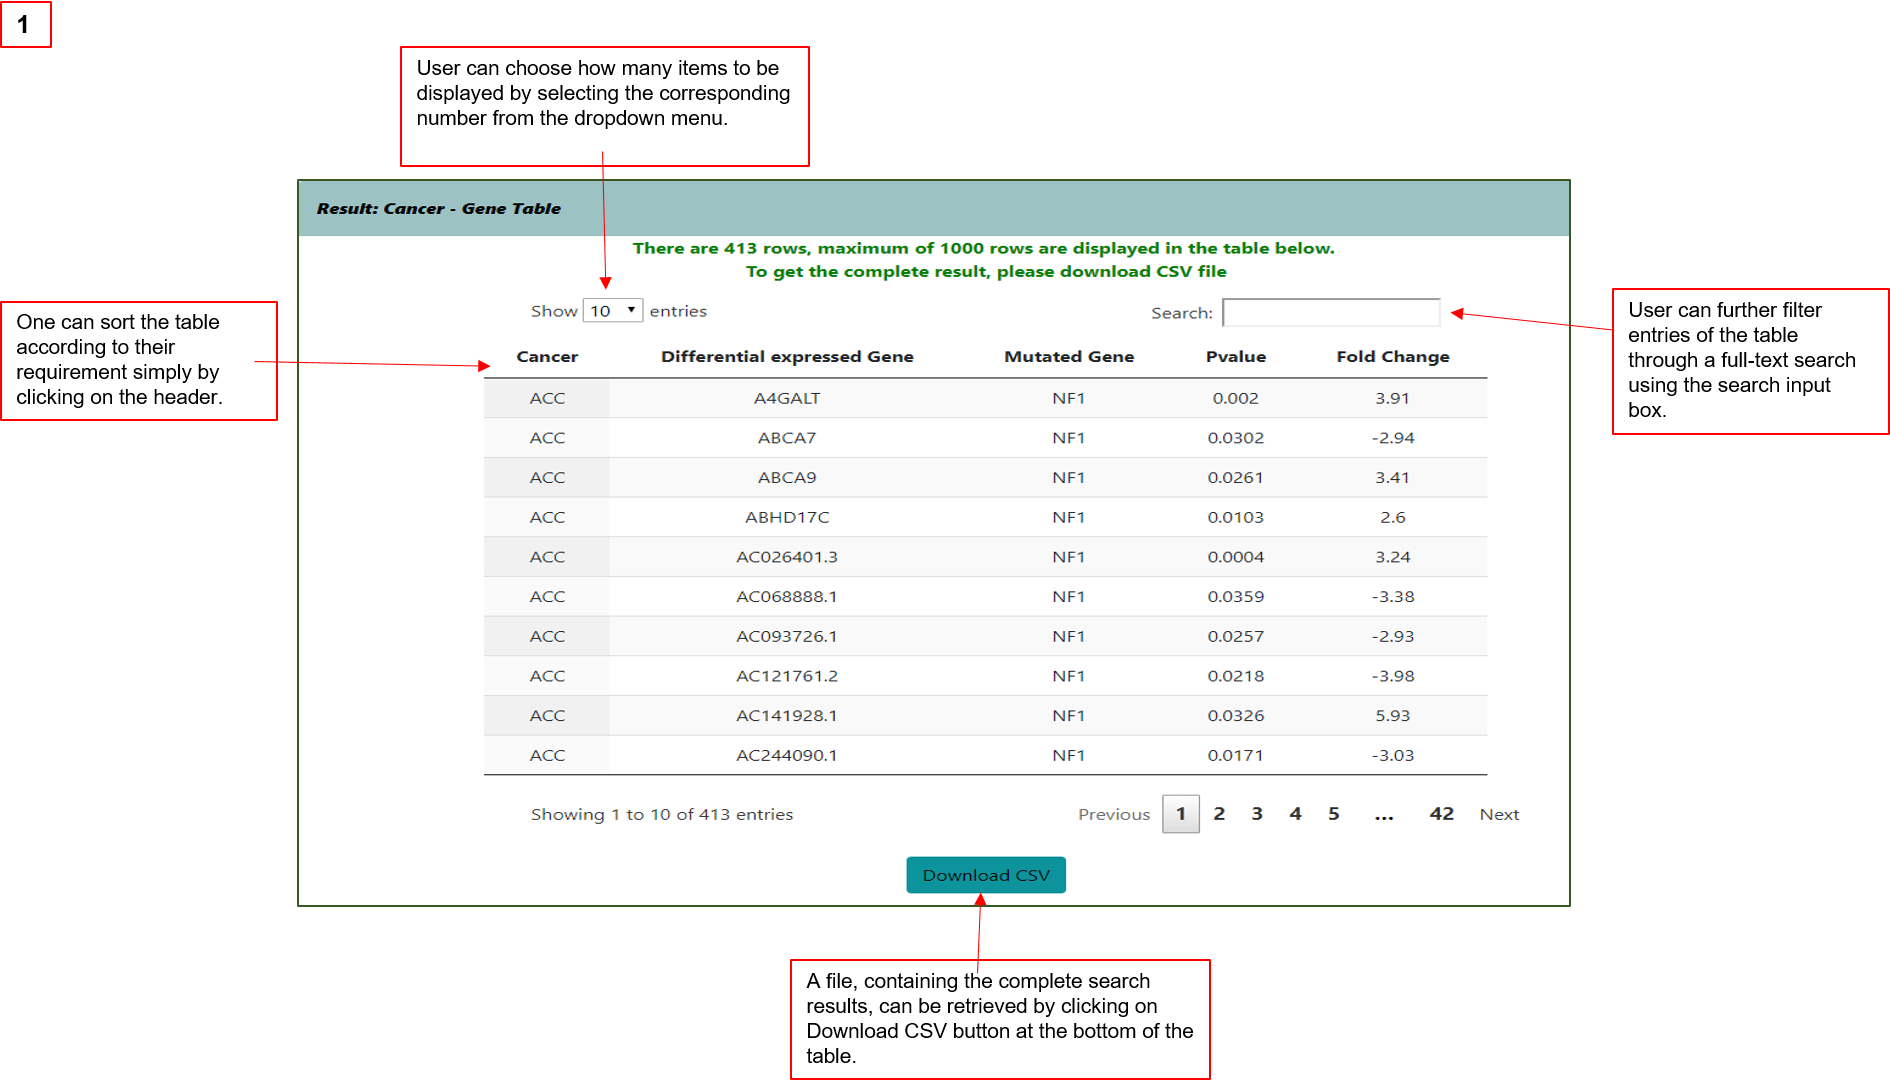
Results are provided in table formats showing (1) the association between mutated gene(s) and differentially expressed genes in selected cancers;
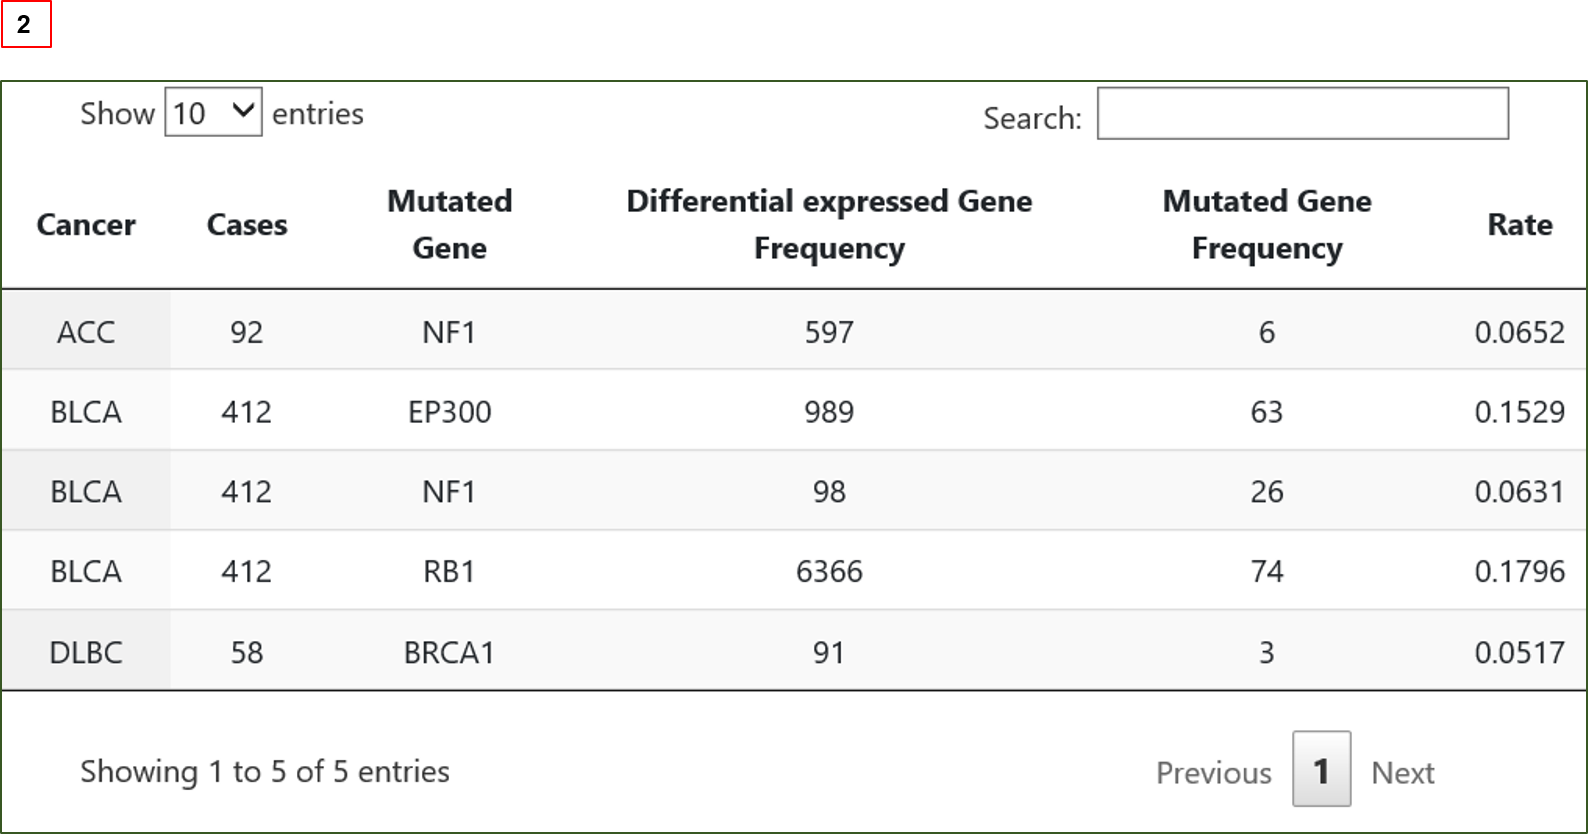
(2)transcriptome dysregulation extensity attributed to individual genes’ mutation.
Advanced Analysis
Advanced analysis results are provided in table format as well as graphical format depending on the options selected.
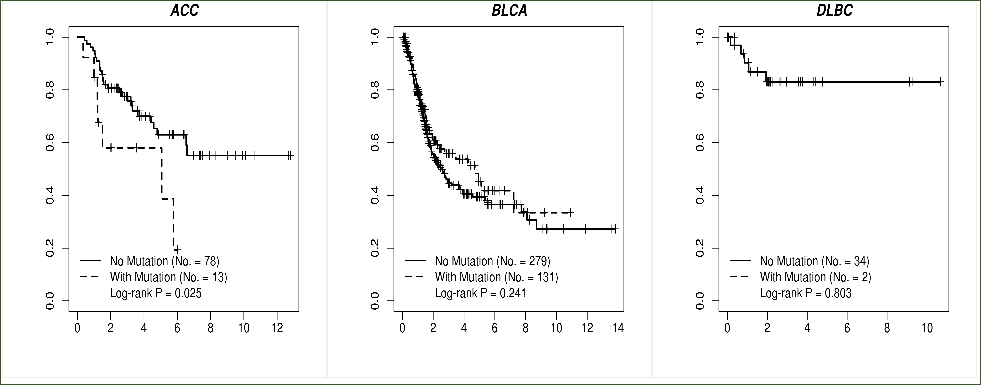
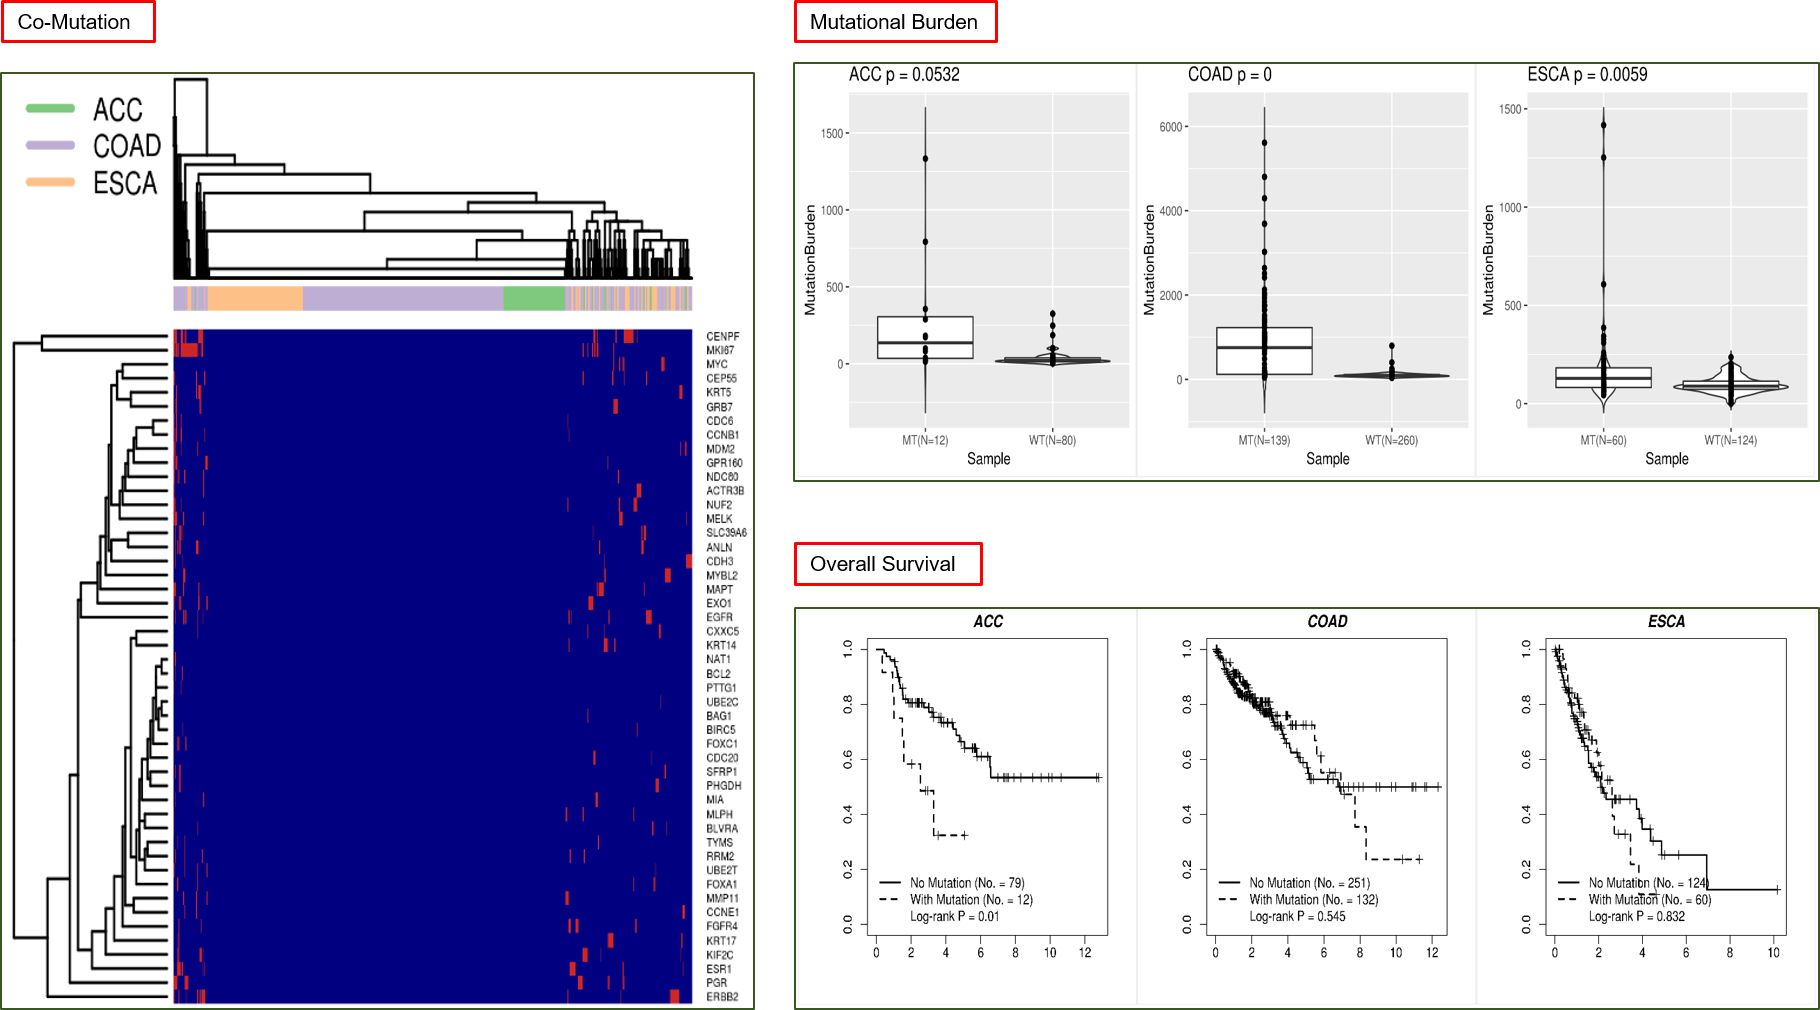
Overall Survival: For each cancer, a plot of binary Kaplan-Meier survival curves will be rendered.
To render these survival curves, subjects of the particular cancer are divided into two groups, based on being mutated or not for any of the input genes (a subject is deemed
“with mutation” as long as one mutation is present in one of the input genes). Result of Log-rank test of survival difference is attached to the survival plot.
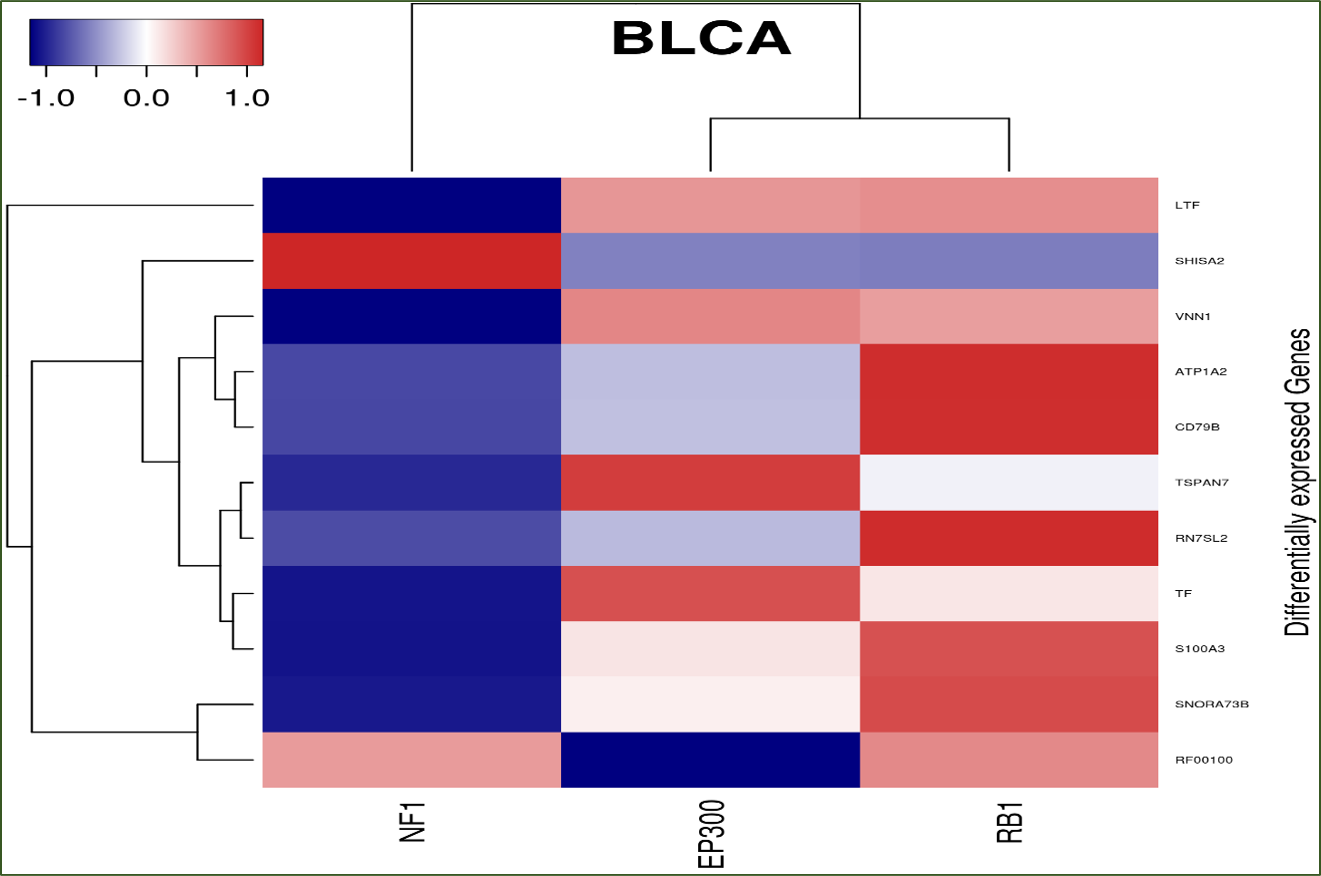
Hierarchical clustering and heatmap: For each cancer, a hierarchical clustering heatmap is produced based on the expression fold changes of the common set of differentially
expressed genes associated with the input genes. The heatmap has one dimension for mutated genes and the other for differentially expressed genes. If no input gene is mutated in the selected cancer type(s), no heatmap
will be generated for that cancer.
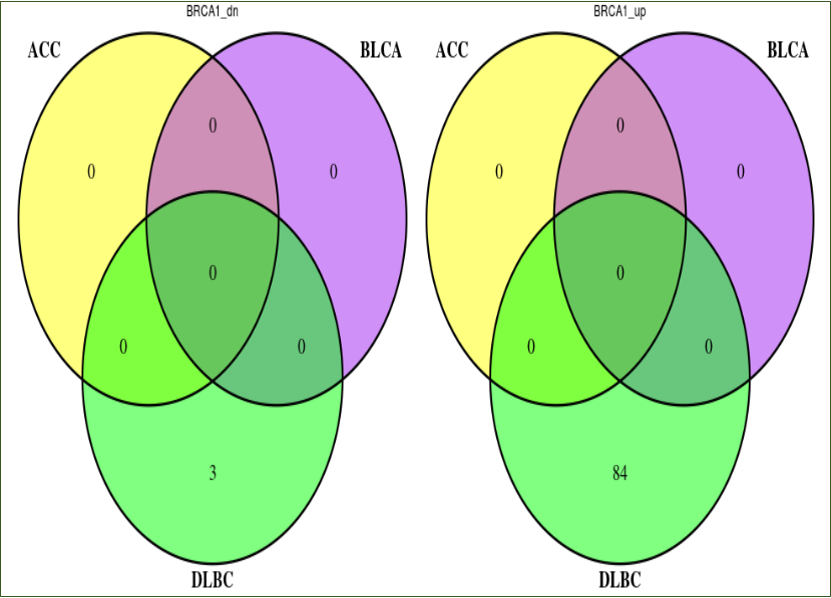
Cross Cancer Comparison: For each mutated gene that has transcriptome dysregulation impact in any selected cancer (Mutated gene in Mutation frequency table), we plot one Venn diagram for
up-regulated gene comparison across cancer and another Venn diagram for down-regulated gene comparison across cancer. If user wishes to run this utility, the number of cancer types
must be limited to five or less.
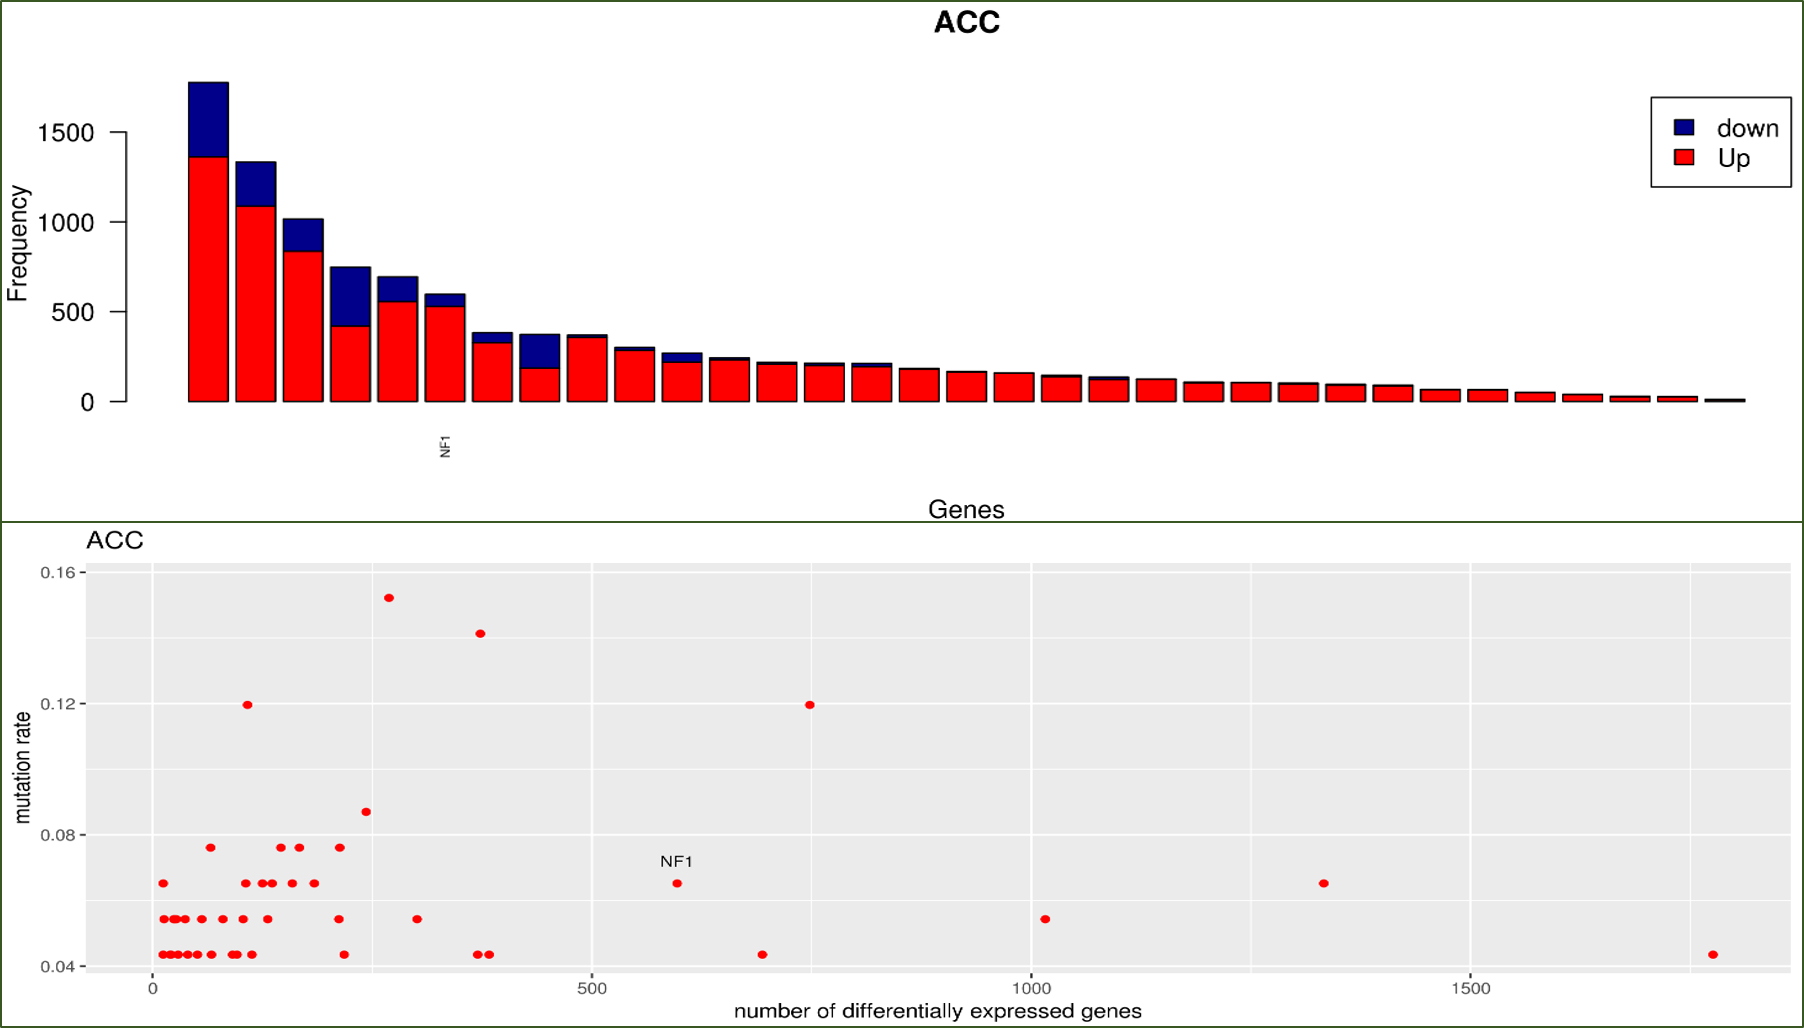
Mutation Impact Ranking: This utility conducts assessment of gene mutation’s global impact on transcriptome, returning the Mutation Impact table and analytical figures. 1) Barplot
sorts all mutated genes by the number of their affected differentially expressed genes and highlights user-specified input genes in the ranked list. 2) scatter plot reveals the
overall relationship between mutation frequency and number of differentially expressed genes with highlighting of specific input genes. The two types of figures are rendered for each
selected cancer individually.
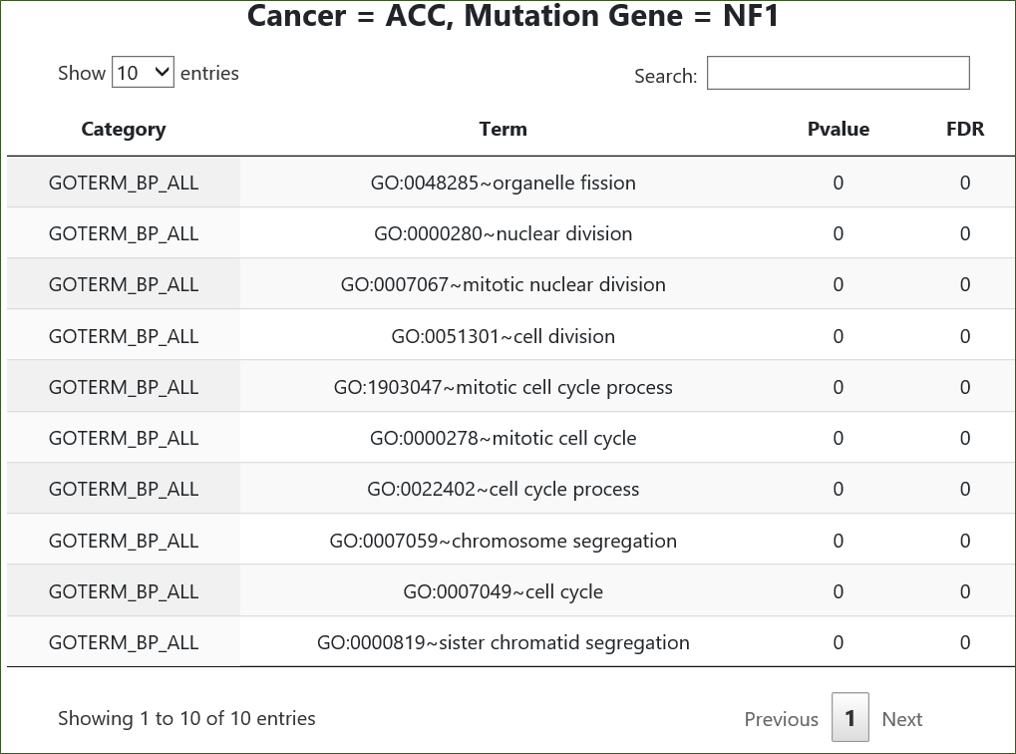
Pathway | GeneOntology: For all input genes, we perform enrichment analysis of their differentially expressed genes against pathways or Gene Ontology terms. If the analysis
criteria is met, one table will be returned for each valid combination of {Cancer, Mutated Gene}. We limit display of each individual table to only ten top-ranking records. Usually it is more
likely to harvest results from DAVID than other options.
Reverse Impact
Function II aims to identify potential causative genes (“mutated genes”) whose mutations are associated with differential expression in the set of interested genes.
Default analysis returns a table on association between mutated gene and differentially expressed genes in selected cancers.
Advanced Analysis
Advanced analysis results are provided in table format as well as graphical format depending on the options selected.
Cross Cancer Comparison: For each mutated gene covered in the output association table, we plot one Venn diagram for up-regulated gene
comparison across cancer and another Venn diagram for down-regulated gene comparison across cancer. The gene numbers shown in Venn diagrams have undergone intersection with
user-input genes.
Hierarchical clustering and heatmap: For each cancer, a hierarchical clustering heatmap is produced based on the expression fold changes
of the common set of mutated genes associated with the input (differentially expressed) genes. The heatmap has one dimension for mutated genes and the other for differentially
expressed genes. If no mutated gene is associated with all input genes, no heatmap will be generated for that cancer.
Mutation Burden and Co-mutation
Function III enables landscape of gene mutations across cancers and visual inspection of mutational burdens affected by the collective mutations in input genes.
Analysis
Analysis results are provided in table format as well as graphical format depending on the options selected.
Co-mutation: Hierarchical clustering on the mutational statuses of the input genes across subjects of the selected cancers. Users can visually inspect if distinct clusters
are formed among patients or genes in the dendrograms accompanying the row/column dimensions of mutation heatmap.
Mutational Burden: For each cancer, a boxplot aligning mutational burden quantities in tumor and normal will be drawn, and two-group t-test result
will be attached to the boxplot. Each dot in the figure corresponds to the sample of a subject, thus all dots altogether forming one group of subjects’ samples, tumor or normal.
*The mutational burden of a subject is defined as the number of nonsynonymous mutations in all genes excluding the gene set used to define mutant and wild-type.
Overall Survival: This is the same utility as implemented in Function I
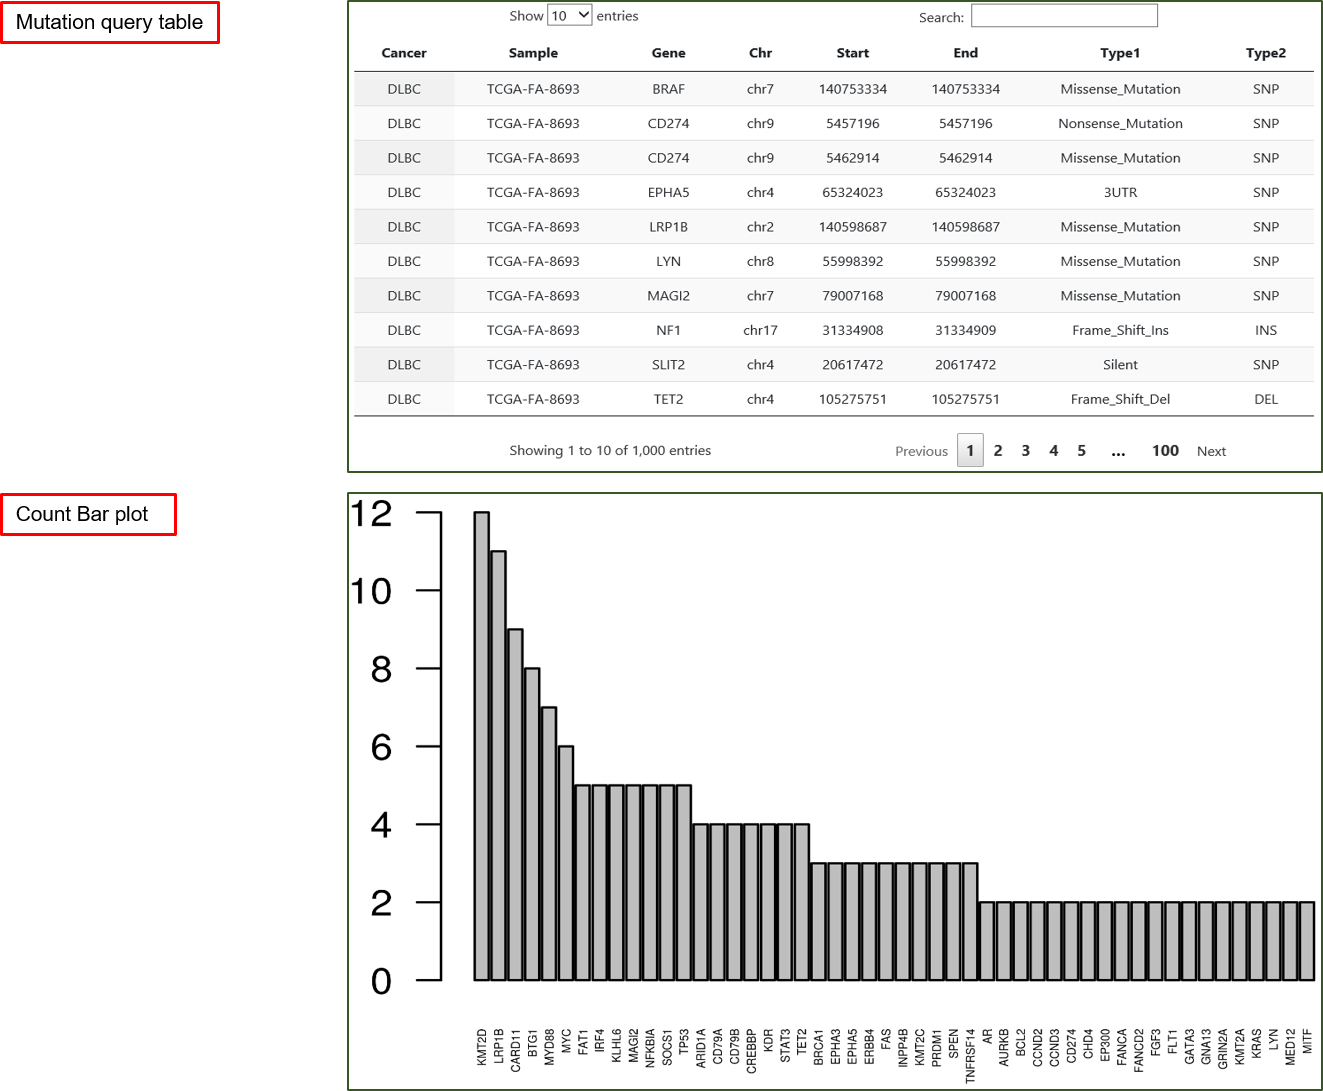
Mutation Query
Function IV enables query of gene mutations by gene names or genomic locations. The sought mutations can be confined to particular subtypes.
Default analysis returns a table on gene mutations in cancer patients and ordered barplots of gene mutation count (barplots are rendered for each cancer separately).
The composite primary key of output table includes {Cancer, Sample, Gene, Chr, Start, End}. The count barplot is truncated at 50 top-ranking genes.
Advanced Expression Survival Analysis
Function V assists with probing survival difference based on expression of input genes.
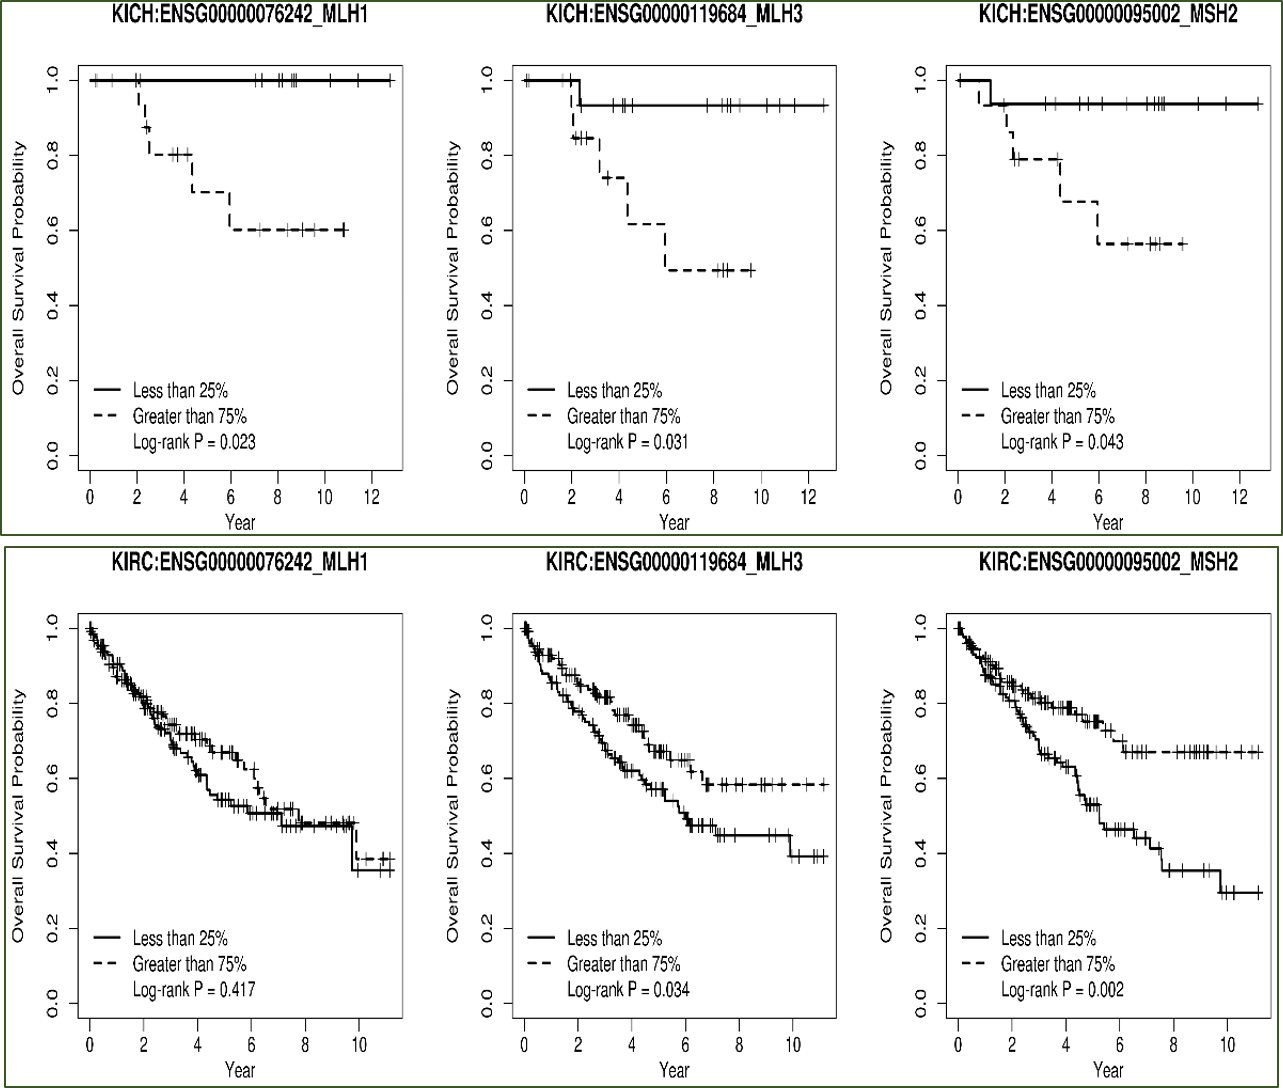
Option 1 - Single gene: Binary Kaplan-Meier curves are rendered dichotomizing patients by expression of a single gene. One survival plot is returned for each combination of cancer and gene.
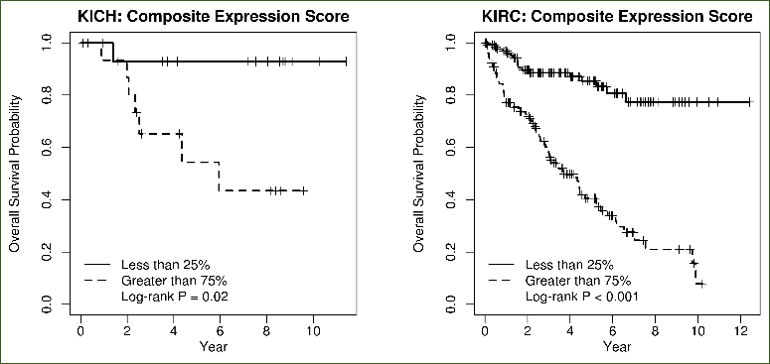
Option 2 - composite gene expression score: Multivariate Cox regression is fit on survival by incorporating all user-input genes, after which
the inferred coefficients of each gene contribute as the individual weights in summation of gene expression values into a composite gene expression score (CGES). One survival plot is
returned for each selected cancer.
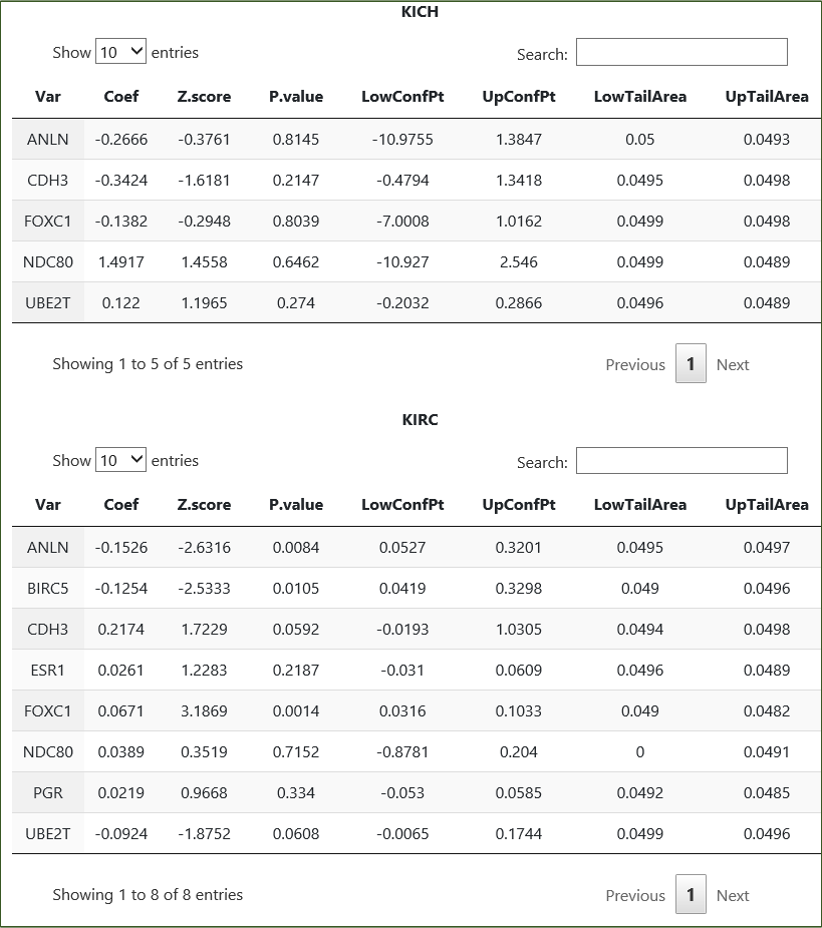
Option 3 - Feature selection then selective inference: Variable selection is conducted with Cox regression on user-input genes, following which
a post-selection inference is performed using R package selectiveInference. Currently, this utility returns user tables on the final genes remaining in the resultant model, for each
cancer separately.
Differential Survival
Function VI aims to identify differentially expressed genes and differentially mutated genes between good survival patients and poor survival patients.
R package edgeR is used for differential expression analysis, and Fisher’s exact test is used for differential mutation analysis. This utility deals with one cancer per session.
Default analysis returns one table on differential expression and another table on differential mutation, as well as paired boxplot for differential expression and paired barplot
for differential mutation.
Optional Pathway | GeneOntology: Functional enrichment analysis is conducted on differentially expressed genes
between good survival patients and poor survival patients.